We examine fully developed flow modes at
![]() from 0.1 to 1.6 with an interval of 0.1 and Refrom 100 to 1500 with an interval of 100.
The Reynolds number Re is suddenly increased from zero to Re0.
At
from 0.1 to 1.6 with an interval of 0.1 and Refrom 100 to 1500 with an interval of 100.
The Reynolds number Re is suddenly increased from zero to Re0.
At
![]() more than unity, our experimental results show that
the wavy Taylor vortex flow appears when Re0 is more than about 1000.
Therefore, the numerical results based on the axisymmetric equations
may not be probable.
On the other hand, when
more than unity, our experimental results show that
the wavy Taylor vortex flow appears when Re0 is more than about 1000.
Therefore, the numerical results based on the axisymmetric equations
may not be probable.
On the other hand, when
![]() is less than unity, the Taylor
vortex flow is not in the ``wavy'' mode but in the ``rotation'' mode shown in
Fig
is less than unity, the Taylor
vortex flow is not in the ``wavy'' mode but in the ``rotation'' mode shown in
Fig
![]() .
.
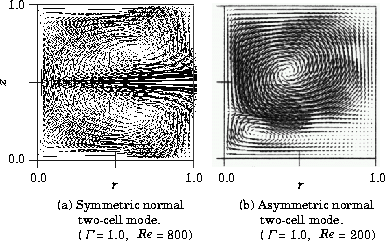
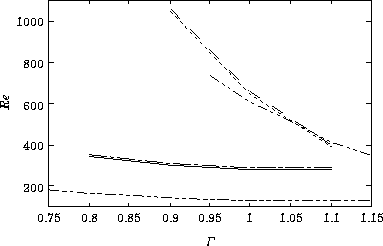
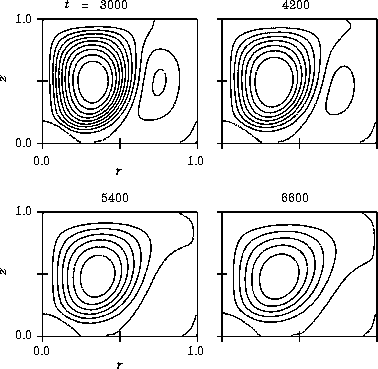
Figure 1 shows established mode patterns. Figures 2, 3 and 4 show velocity vectors in the normal two-cell mode (N2), anomalous one-cell mode (A1) and twin-cell mode (TWIN), respectively. In each velocity vector figure, the rotating inner cylinder is on the left and the stationary outer cylinder is on the right. Figures 3 and 4 include flow patterns obtained by Nakamura and Toya (1996).
When
Re is small,
the N2 mode is formed, as shown in
Fig
![]() .
The N2 mode gives inward flow near the end walls
and outward flow near the mid plane in the axial direction.
This numerical evidence is confirmed by our experiment.
In the N2 mode, symmetric and asymmetric patterns appear.
In order to compare the symmetry about the
mid plane in the axial direction,
the coordinates of the maximum value of
.
The N2 mode gives inward flow near the end walls
and outward flow near the mid plane in the axial direction.
This numerical evidence is confirmed by our experiment.
In the N2 mode, symmetric and asymmetric patterns appear.
In order to compare the symmetry about the
mid plane in the axial direction,
the coordinates of the maximum value of ![]() ,
(rmax, zmax),
and that of the minimum value of
,
(rmax, zmax),
and that of the minimum value of ![]() ,
(rmin, zmin), are
determined.
While
(rmax, zmax)=(0.46, 0.31) and
(rmin, zmin)=(0.46, 0.69) in Fig
,
(rmin, zmin), are
determined.
While
(rmax, zmax)=(0.46, 0.31) and
(rmin, zmin)=(0.46, 0.69) in Fig
![]() (a),
(rmax, zmax)=(0.21, 0.17) and
(rmin, zmin)=(0.42, 0.56) in Fig
(a),
(rmax, zmax)=(0.21, 0.17) and
(rmin, zmin)=(0.42, 0.56) in Fig
![]() (b).
Cliffe (1983) calls this asymmetric flow ``single-cell flow''.
(b).
Cliffe (1983) calls this asymmetric flow ``single-cell flow''.
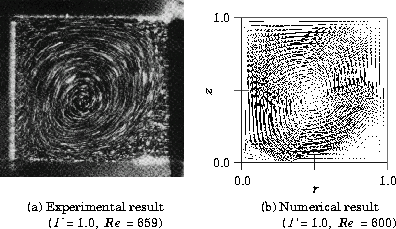
Figure 3 shows an example of the A1 mode.
In Fig
![]() (b), the anomalous cell
rotates in a counterclockwise direction. It is
accompanied by extra cells which rotate in the
clockwise direction at both the inner
and outer cylinder sides, though the extra outer cell is very weak and
is not clearly shown.
The calculated flow pattern agrees with the experimental result obtained
by Nakamura and Toya (1996) shown in Fig
(b), the anomalous cell
rotates in a counterclockwise direction. It is
accompanied by extra cells which rotate in the
clockwise direction at both the inner
and outer cylinder sides, though the extra outer cell is very weak and
is not clearly shown.
The calculated flow pattern agrees with the experimental result obtained
by Nakamura and Toya (1996) shown in Fig
![]() (a).
(a).
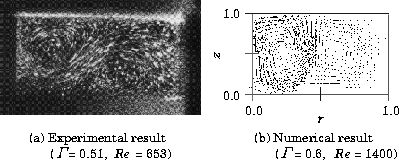
When
![]() is from 0.6 to 0.9 and
Re is from 1000 to 1500, the TWIN mode appears, as shown in Fig
is from 0.6 to 0.9 and
Re is from 1000 to 1500, the TWIN mode appears, as shown in Fig
![]() (b).
The TWIN mode has separation points on both end walls of
the cylinders.
In Fig
(b).
The TWIN mode has separation points on both end walls of
the cylinders.
In Fig
![]() (b), two large cells and one small cell
are observed.
The large cell on the left rotates in a counterclockwise
direction and the other large cell rotates in a clockwise direction.
The small cell, which rotates in a clockwise
direction, is located at the inner lower corner.
Numerical results agree with the experimental results
by Nakamura and Toya (1996) shown in Fig
(b), two large cells and one small cell
are observed.
The large cell on the left rotates in a counterclockwise
direction and the other large cell rotates in a clockwise direction.
The small cell, which rotates in a clockwise
direction, is located at the inner lower corner.
Numerical results agree with the experimental results
by Nakamura and Toya (1996) shown in Fig
![]() (a), although the corresponding
Reynolds number is not exactly the same.
As far as we know, numerical confirmation of the existence of the
twin-cell mode is not given in the previous studies.
(a), although the corresponding
Reynolds number is not exactly the same.
As far as we know, numerical confirmation of the existence of the
twin-cell mode is not given in the previous studies.
 |
 |
 |
 |